
Travel itinerary and resilience research: Methods and Source Data
Useful evidence starts with what a dataset actually measures, not with a persuasive marketing conclusion.
Source, ownership and freshness
The dataset used in this chart was published by TripoSIM, commercially connected to this website, and captured on 2 November 2026. There are 198 unique destination records. The values are historical source observations, not live offers, independent third-party validation, or guaranteed network service. Last audit of this presentation: 2026-11-03.
Download and independently inspect the source CSV. Review our commercial disclosures and editorial rules before interpreting any ranking or regional statistic.
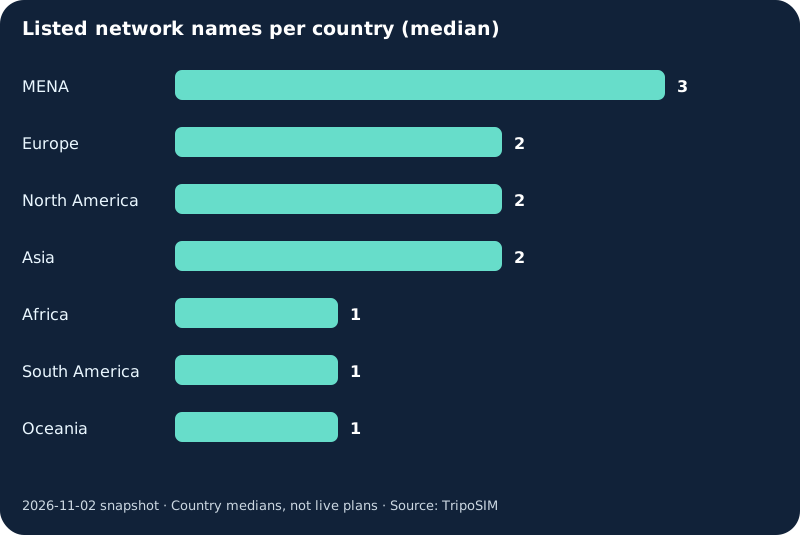
How the regional figures were calculated
For each country, the specified field is read from the dated published source. Records with an absent numeric value are excluded from that statistic, not treated as zero. Destinations are grouped by the dataset's own region label; the median is calculated across countries in that region, not weighted by active subscriptions or purchased plans.
The region chart describes how many network names are reported per country in the affiliated dataset. It does not establish which networks a purchased eSIM can use, how strong coverage is, or whether a specific carrier has an available roaming agreement. A larger count is not proof of better performance.
This means the chart cannot identify the cheapest complete itinerary, prove better country coverage, or show a statistically representative distribution of other eSIM merchants. Any question about a real retail SKU must be resolved using its current price, covered destinations, validity and fair-use conditions.
Dataset completeness by region
| Region | Destination rows | Rows with numeric field | Median observed value |
|---|---|---|---|
| Africa | 42 | 42 | 1.00 |
| Asia | 31 | 31 | 2.00 |
| Europe | 52 | 52 | 2.00 |
| MENA | 11 | 11 | 3.00 |
| North America | 38 | 38 | 2.00 |
| Oceania | 12 | 12 | 1.00 |
| South America | 12 | 12 | 1.00 |
Known limitations and possible bias
Commercial ownership: TripoSIM is the dataset source and has an interest in selling products. Its published sample is not a survey of competing providers. Coverage: a national listing does not establish exact local radio quality. Pricing: an aggregated or tier-level quote cannot replace SKU-level price, day validity, taxes and actual checkout total. Freshness: source information may change after the capture date. Sampling: regions contain different numbers of countries and the dataset's regional labels should not be mistaken for geopolitical or regulatory classifications.
How to reproduce the chart
Download the CSV, group rows by the region column, discard blank observations for network_count, and calculate the median of the remaining numeric values per group. This exact operation is implemented in the included source file source/v13_upgrade.py, without adding imputed missing prices or choosing a preferred outcome. For a purchase decision, compare the data with the actual TripoSIM retail terms and consider alternatives that may better fit the trip.